Consider three different distributions defined over three different domains of support …
Let ![]() with pdf f(x),
let
with pdf f(x),
let ![]() with pdf g(y),
and let Z ∼ half-Halo with pdf h(z):
with pdf g(y),
and let Z ∼ half-Halo with pdf h(z):
In[1]:= 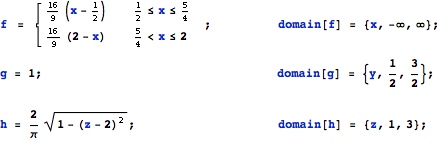
Here are the three pdf’s illustrated:
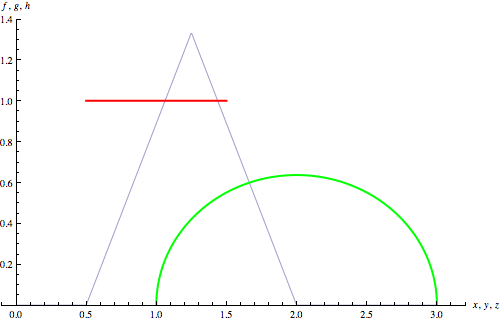
Suprematism No. 1: f(·) Triangular g(·) Uniform h(·) half-Halo
We seek the pdf of W = max(X, Y, Z) . The solution pdf is simply:
In[2]:= ![]()
Out[2]:= 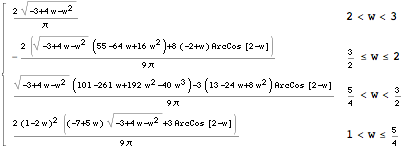
Here is a plot of the pdf of the maximum, together with the underlying pdf’s:
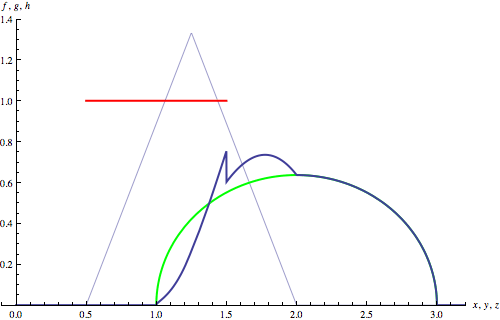
Suprematism No. 2: The Malevich Maximum — pdf of the maximum, together with the 3 underlying pdf’s
![]()
Let ![]() with pdf f(x):
with pdf f(x):
In[1]:= ![]()
Here are the six pdf’s corresponding to b = 1, 2, 3, 4, 5 and 6:
In[2]:= ![]()
Out[2]= 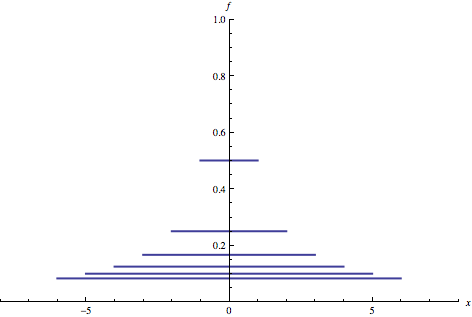
Problem: Find the pdf of ![]() .
.
Solution: The solution pdf is simply:
In[3]:= ![]()
Out[3]= 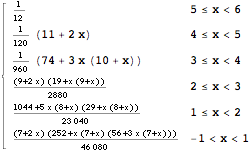
with domain of support: (we define piecewise functions over the real line)
In[4]:= ![]()
Here is a plot of the solution pdf:
In[5]:= ![]()
Out[5]= 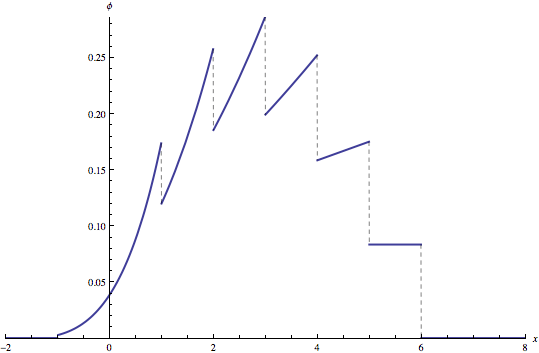
A quick Monte Carlo 'check’ of the exact solution we have just plotted:
We first generate 6 pseudo-random data sets corresponding to ![]() , and each containing 250000 pseudo-random drawings:
, and each containing 250000 pseudo-random drawings:
In[6]:= ![]()
Next, we transpose from 6 data sets each of size 250000 … to … 250000 samples each of size 6. Each sample of 6 represents a single pseudo-random drawing from ![]() . Then, we map the Max function across each sample of 6, generating our 250000 empirical drawings of the sample maximum:
. Then, we map the Max function across each sample of 6, generating our 250000 empirical drawings of the sample maximum:
In[7]:= ![]()
We can now make a frequency plot to compare the pseudo-random Monte Carlo solution (—) with the theoretical symbolic solution φ(x) (—) derived above:
In[8]:= ![]()
Out[8]= 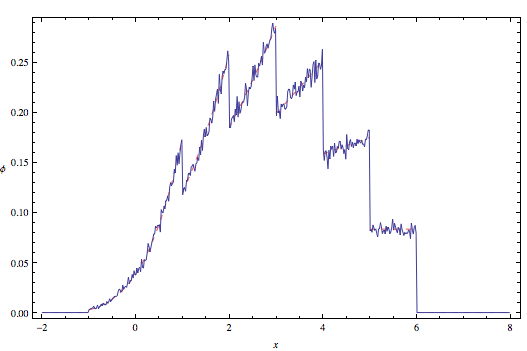
For the win!
![]()
Let X ∼ Pareto(a, b) with pdf f(x):
In[1]:= ![]()
and let Y ∼ Exponential(λ) with pdf g(y):
In[2]:= ![]()
Problem: Find the pdf of W = min(X, Y).
Solution: The solution is simply:
In[3]:= ![]()
Out[3]= 